
O Brasil tinha 122.102 pessoas monitoradas por tornozeleira eletrônica no fim de 2024, apontam dados da Secretaria Nacional de Políticas Penais (Senappen).
Os números são atualizados a cada semestre ? os índices de janeiro a junho deste ano devem ser divulgados em agosto. Desde o começo da série histórica em 2016, no entanto, o total cresce a cada semestre (veja gráfico abaixo).
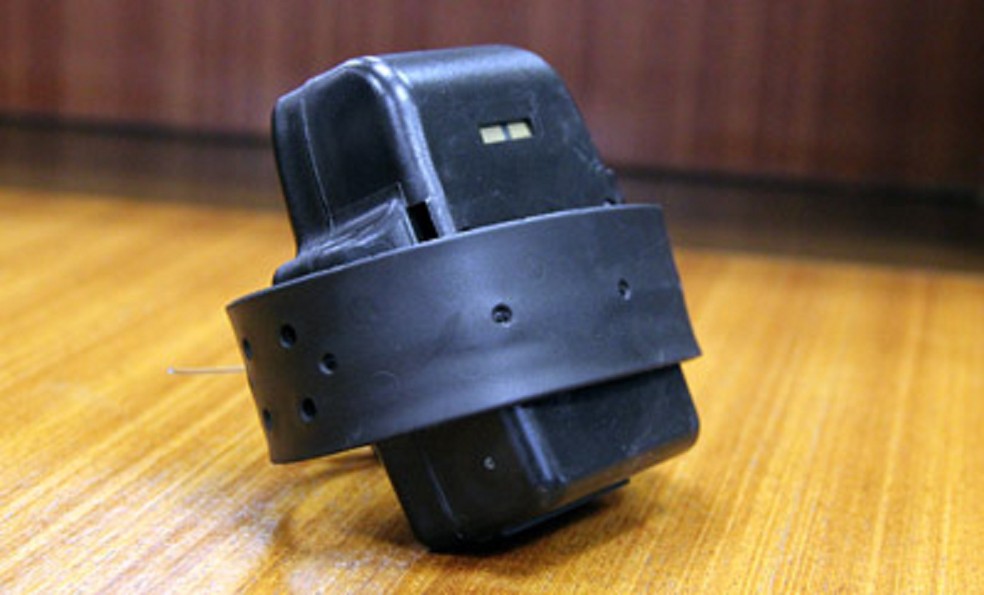
? Tornozeleira eletrônica: o equipamento faz o monitoramento de pessoas investigadas pela Justiça. A ferramenta tem 128 gramas e é equipada com um GPS e modem para transmissão de dados via sinal de celular.
Dos mais de 120 mil monitorados no fim de 2024, 107.393 eram homens, o equivalente a 87,95% do total. Havia, também, 14.709 mulheres usando o dispositivo.
O número da Senappen não inclui quem passou a ser monitorado desde janeiro ? como o ex-presidente Jair Bolsonaro, que passou a usar tornozeleira nesta sexta-feira (18) por ordem do Supremo Tribunal Federal.
Veja detalhes no vídeo abaixo:
LEIA TAMBÉM:
- CASA DE BOLSONARO: veja onde fica a casa de Bolsonaro alvo de operação da PF em Brasília
- TORNOZELEIRA ELETRÔNICA: além de Bolsonaro, DF monitora mais de 1,5 mil equipamentos
O perfil dos monitorados
A pesquisa, que leva em conta os dados do segundo semestre de 2024, aponta o perfil dos monitorados:
- Presos provisórios (sem condenação): 29.553
- Presos sentenciados (regime fechado): 4.239
- Presos sentenciados (regime semiaberto): 65.673
- Presos sentenciados (regime aberto): 22.111
- Medida de segurança ? internação: 208
- Medida de segurança ? tratamento ambulatório: 318
Aumento do uso de tornozeleiras eletrônicas
O levantamento, que é realizado por semestre, foi iniciado no segundo de 2016. Nos últimos oito anos, houve um aumento do uso de tornozeleiras eletrônicas de 95,06%.
Em 2016, o número total de monitorados por tornozeleira eletrônica do país era de 6.027 pessoas, em 2024, são 122.102 (veja abaixo).
(function () {
const chartData = {“APIDocumentID”:”ec32324e-7936-44da-a126-ba2e6635991d”,”options”:{“categories”:[“2u00b0/2016″,”1u00b0/2017″,”2u00b0/2017″,”1u00b0/2018″,”2u00b0/2018″,”1u00b0/2019″,”2u00b0/2019″,”1u00b0/2020″,”2u00b0/2020″,”1u00b0/2021″,”2u00b0/2021″,”1u00b0/2022″,”2u00b0/2022″,”1u00b0/2023″,”2u00b0/2023″,”1u00b0/2024″,”2u00b0/2024″],”credits”:”Senappen”,”data”:[{“name”:””,”value”:[“6027″,”6003″,”7310″,”9887″,”10918″,”14295″,”16821″,”51897″,”72720″,”73105″,”80332″,”87448″,”91362″,”92894″,”100755″,”105104″,”122102″]}],”labels”:false,”numberOfMarkers”:17,”subtitle”:”u00cdndice apresenta aumento de 95,06%”,”title”:”Populau00e7u00e3o domiciliar com monitoramento”,”yAxisTitle”:”Quantidade de pessoas”},”svg”:”%3Csvg xmlns:xlink=u0027http://www.w3.org/1999/xlinku0027 version=u00271.1u0027 class=u0027highcharts-rootu0027 style=u0027font-family:%26quot%3Bopensans%26quot%3B%2C %26quot%3Bopen sans%26quot%3B%2C %26quot%3Bhelvetica%26quot%3B%2C %26quot%3Bverdana%26quot%3B%3Bfont-size:12px%3Bcolor:%23333333%3Bfill:%23333333%3Bu0027 xmlns=u0027http://www.w3.org/2000/svgu0027 width=u0027600u0027 height=u0027400u0027 viewBox=u00270 0 600 400u0027%3E%3Cdesc%3ECreated with Highcharts 5.0.9%3C/desc%3E%3Cdefs%3E%3CclipPath id=u0027highcharts-jr5z15d-1146u0027%3E%3Crect x=u00270u0027 y=u00270u0027 width=u0027526u0027 height=u0027326u0027 fill=u0027noneu0027%3E%3C/rect%3E%3C/clipPath%3E%3C/defs%3E%3Crect fill=u0027transparentu0027 class=u0027highcharts-backgroundu0027 x=u00270u0027 y=u00270u0027 width=u0027600u0027 height=u0027400u0027 rx=u00270u0027 ry=u00270u0027%3E%3C/rect%3E%3Crect fill=u0027noneu0027 class=u0027highcharts-plot-backgroundu0027 x=u002764u0027 y=u002710u0027 width=u0027526u0027 height=u0027326u0027%3E%3C/rect%3E%3Cg class=u0027highcharts-grid highcharts-xaxis-grid u0027%3E%3Cpath fill=u0027noneu0027 class=u0027highcharts-grid-lineu0027 d=u0027M 94.5 10 L 94.5 336u0027 opacity=u00271u0027%3E%3C/path%3E%3Cpath fill=u0027noneu0027 class=u0027highcharts-grid-lineu0027 d=u0027M 125.5 10 L 125.5 336u0027 opacity=u00271u0027%3E%3C/path%3E%3Cpath fill=u0027noneu0027 class=u0027highcharts-grid-lineu0027 d=u0027M 156.5 10 L 156.5 336u0027 opacity=u00271u0027%3E%3C/path%3E%3Cpath fill=u0027noneu0027 class=u0027highcharts-grid-lineu0027 d=u0027M 187.5 10 L 187.5 336u0027 opacity=u00271u0027%3E%3C/path%3E%3Cpath fill=u0027noneu0027 class=u0027highcharts-grid-lineu0027 d=u0027M 218.5 10 L 218.5 336u0027 opacity=u00271u0027%3E%3C/path%3E%3Cpath fill=u0027noneu0027 class=u0027highcharts-grid-lineu0027 d=u0027M 249.5 10 L 249.5 336u0027 opacity=u00271u0027%3E%3C/path%3E%3Cpath fill=u0027noneu0027 class=u0027highcharts-grid-lineu0027 d=u0027M 280.5 10 L 280.5 336u0027 opacity=u00271u0027%3E%3C/path%3E%3Cpath fill=u0027noneu0027 class=u0027highcharts-grid-lineu0027 d=u0027M 311.5 10 L 311.5 336u0027 opacity=u00271u0027%3E%3C/path%3E%3Cpath fill=u0027noneu0027 class=u0027highcharts-grid-lineu0027 d=u0027M 341.5 10 L 341.5 336u0027 opacity=u00271u0027%3E%3C/path%3E%3Cpath fill=u0027noneu0027 class=u0027highcharts-grid-lineu0027 d=u0027M 372.5 10 L 372.5 336u0027 opacity=u00271u0027%3E%3C/path%3E%3Cpath fill=u0027noneu0027 class=u0027highcharts-grid-lineu0027 d=u0027M 403.5 10 L 403.5 336u0027 opacity=u00271u0027%3E%3C/path%3E%3Cpath fill=u0027noneu0027 class=u0027highcharts-grid-lineu0027 d=u0027M 434.5 10 L 434.5 336u0027 opacity=u00271u0027%3E%3C/path%3E%3Cpath fill=u0027noneu0027 class=u0027highcharts-grid-lineu0027 d=u0027M 465.5 10 L 465.5 336u0027 opacity=u00271u0027%3E%3C/path%3E%3Cpath fill=u0027noneu0027 class=u0027highcharts-grid-lineu0027 d=u0027M 496.5 10 L 496.5 336u0027 opacity=u00271u0027%3E%3C/path%3E%3Cpath fill=u0027noneu0027 class=u0027highcharts-grid-lineu0027 d=u0027M 527.5 10 L 527.5 336u0027 opacity=u00271u0027%3E%3C/path%3E%3Cpath fill=u0027noneu0027 class=u0027highcharts-grid-lineu0027 d=u0027M 558.5 10 L 558.5 336u0027 opacity=u00271u0027%3E%3C/path%3E%3Cpath fill=u0027noneu0027 class=u0027highcharts-grid-lineu0027 d=u0027M 589.5 10 L 589.5 336u0027 opacity=u00271u0027%3E%3C/path%3E%3Cpath fill=u0027noneu0027 class=u0027highcharts-grid-lineu0027 d=u0027M 63.5 10 L 63.5 336u0027 opacity=u00271u0027%3E%3C/path%3E%3C/g%3E%3Cg class=u0027highcharts-grid highcharts-yaxis-grid u0027%3E%3Cpath fill=u0027noneu0027 stroke=u0027%23e6e6e6u0027 stroke-width=u00271u0027 class=u0027highcharts-grid-lineu0027 d=u0027M 64 336.5 L 590 336.5u0027 opacity=u00271u0027%3E%3C/path%3E%3Cpath fill=u0027noneu0027 stroke=u0027%23e6e6e6u0027 stroke-width=u00271u0027 class=u0027highcharts-grid-lineu0027 d=u0027M 64 282.5 L 590 282.5u0027 opacity=u00271u0027%3E%3C/path%3E%3Cpath fill=u0027noneu0027 stroke=u0027%23e6e6e6u0027 stroke-width=u00271u0027 class=u0027highcharts-grid-lineu0027 d=u0027M 64 227.5 L 590 227.5u0027 opacity=u00271u0027%3E%3C/path%3E%3Cpath fill=u0027noneu0027 stroke=u0027%23e6e6e6u0027 stroke-width=u00271u0027 class=u0027highcharts-grid-lineu0027 d=u0027M 64 173.5 L 590 173.5u0027 opacity=u00271u0027%3E%3C/path%3E%3Cpath fill=u0027noneu0027 stroke=u0027%23e6e6e6u0027 stroke-width=u00271u0027 class=u0027highcharts-grid-lineu0027 d=u0027M 64 119.5 L 590 119.5u0027 opacity=u00271u0027%3E%3C/path%3E%3Cpath fill=u0027noneu0027 stroke=u0027%23e6e6e6u0027 stroke-width=u00271u0027 class=u0027highcharts-grid-lineu0027 d=u0027M 64 64.5 L 590 64.5u0027 opacity=u00271u0027%3E%3C/path%3E%3Cpath fill=u0027noneu0027 stroke=u0027%23e6e6e6u0027 stroke-width=u00271u0027 class=u0027highcharts-grid-lineu0027 d=u0027M 64 10.5 L 590 10.5u0027 opacity=u00271u0027%3E%3C/path%3E%3C/g%3E%3Crect fill=u0027noneu0027 class=u0027highcharts-plot-borderu0027 x=u002764u0027 y=u002710u0027 width=u0027526u0027 height=u0027326u0027%3E%3C/rect%3E%3Cg class=u0027highcharts-axis highcharts-xaxis u0027%3E%3Cpath fill=u0027noneu0027 class=u0027highcharts-ticku0027 stroke=u0027%23ccd6ebu0027 stroke-width=u00271u0027 d=u0027M 94.5 336 L 94.5 346u0027 opacity=u00271u0027%3E%3C/path%3E%3Cpath fill=u0027noneu0027 class=u0027highcharts-ticku0027 stroke=u0027%23ccd6ebu0027 stroke-width=u00271u0027 d=u0027M 125.5 336 L 125.5 346u0027 opacity=u00271u0027%3E%3C/path%3E%3Cpath fill=u0027noneu0027 class=u0027highcharts-ticku0027 stroke=u0027%23ccd6ebu0027 stroke-width=u00271u0027 d=u0027M 156.5 336 L 156.5 346u0027 opacity=u00271u0027%3E%3C/path%3E%3Cpath fill=u0027noneu0027 class=u0027highcharts-ticku0027 stroke=u0027%23ccd6ebu0027 stroke-width=u00271u0027 d=u0027M 187.5 336 L 187.5 346u0027 opacity=u00271u0027%3E%3C/path%3E%3Cpath fill=u0027noneu0027 class=u0027highcharts-ticku0027 stroke=u0027%23ccd6ebu0027 stroke-width=u00271u0027 d=u0027M 218.5 336 L 218.5 346u0027 opacity=u00271u0027%3E%3C/path%3E%3Cpath fill=u0027noneu0027 class=u0027highcharts-ticku0027 stroke=u0027%23ccd6ebu0027 stroke-width=u00271u0027 d=u0027M 249.5 336 L 249.5 346u0027 opacity=u00271u0027%3E%3C/path%3E%3Cpath fill=u0027noneu0027 class=u0027highcharts-ticku0027 stroke=u0027%23ccd6ebu0027 stroke-width=u00271u0027 d=u0027M 280.5 336 L 280.5 346u0027 opacity=u00271u0027%3E%3C/path%3E%3Cpath fill=u0027noneu0027 class=u0027highcharts-ticku0027 stroke=u0027%23ccd6ebu0027 stroke-width=u00271u0027 d=u0027M 311.5 336 L 311.5 346u0027 opacity=u00271u0027%3E%3C/path%3E%3Cpath fill=u0027noneu0027 class=u0027highcharts-ticku0027 stroke=u0027%23ccd6ebu0027 stroke-width=u00271u0027 d=u0027M 341.5 336 L 341.5 346u0027 opacity=u00271u0027%3E%3C/path%3E%3Cpath fill=u0027noneu0027 class=u0027highcharts-ticku0027 stroke=u0027%23ccd6ebu0027 stroke-width=u00271u0027 d=u0027M 372.5 336 L 372.5 346u0027 opacity=u00271u0027%3E%3C/path%3E%3Cpath fill=u0027noneu0027 class=u0027highcharts-ticku0027 stroke=u0027%23ccd6ebu0027 stroke-width=u00271u0027 d=u0027M 403.5 336 L 403.5 346u0027 opacity=u00271u0027%3E%3C/path%3E%3Cpath fill=u0027noneu0027 class=u0027highcharts-ticku0027 stroke=u0027%23ccd6ebu0027 stroke-width=u00271u0027 d=u0027M 434.5 336 L 434.5 346u0027 opacity=u00271u0027%3E%3C/path%3E%3Cpath fill=u0027noneu0027 class=u0027highcharts-ticku0027 stroke=u0027%23ccd6ebu0027 stroke-width=u00271u0027 d=u0027M 465.5 336 L 465.5 346u0027 opacity=u00271u0027%3E%3C/path%3E%3Cpath fill=u0027noneu0027 class=u0027highcharts-ticku0027 stroke=u0027%23ccd6ebu0027 stroke-width=u00271u0027 d=u0027M 496.5 336 L 496.5 346u0027 opacity=u00271u0027%3E%3C/path%3E%3Cpath fill=u0027noneu0027 class=u0027highcharts-ticku0027 stroke=u0027%23ccd6ebu0027 stroke-width=u00271u0027 d=u0027M 527.5 336 L 527.5 346u0027 opacity=u00271u0027%3E%3C/path%3E%3Cpath fill=u0027noneu0027 class=u0027highcharts-ticku0027 stroke=u0027%23ccd6ebu0027 stroke-width=u00271u0027 d=u0027M 558.5 336 L 558.5 346u0027 opacity=u00271u0027%3E%3C/path%3E%3Cpath fill=u0027noneu0027 class=u0027highcharts-ticku0027 stroke=u0027%23ccd6ebu0027 stroke-width=u00271u0027 d=u0027M 590.5 336 L 590.5 346u0027 opacity=u00271u0027%3E%3C/path%3E%3Cpath fill=u0027noneu0027 class=u0027highcharts-ticku0027 stroke=u0027%23ccd6ebu0027 stroke-width=u00271u0027 d=u0027M 63.5 336 L 63.5 346u0027 opacity=u00271u0027%3E%3C/path%3E%3Cpath fill=u0027noneu0027 class=u0027highcharts-axis-lineu0027 stroke=u0027%23ccd6ebu0027 stroke-width=u00271u0027 d=u0027M 64 336.5 L 590 336.5u0027%3E%3C/path%3E%3C/g%3E%3Cg class=u0027highcharts-axis highcharts-yaxis u0027%3E%3Ctext x=u002711.089986801147461u0027 text-anchor=u0027middleu0027 transform=u0027translate(0%2C0) rotate(270 11.089986801147461 173)u0027 class=u0027highcharts-axis-titleu0027 style=u0027color:%23333%3Bfont-weight:bold%3Bfont-size:12px%3Bfill:%23333%3Bu0027 y=u0027173u0027%3E%3Ctspan%3EQuantidade de pessoas%3C/tspan%3E%3C/text%3E%3Cpath fill=u0027noneu0027 class=u0027highcharts-axis-lineu0027 d=u0027M 64 10 L 64 336u0027%3E%3C/path%3E%3C/g%3E%3Cg class=u0027highcharts-series-groupu0027%3E%3Cg class=u0027highcharts-series highcharts-series-0 highcharts-line-series highcharts-color-undefined u0027 transform=u0027translate(64%2C10) scale(1 1)u0027 clip-path=u0027url(%23highcharts-jr5z15d-1146)u0027%3E%3Cpath fill=u0027noneu0027 d=u0027M 15.470588235294 312.90132 L 46.411764705882 312.95348 L 77.352941176471 310.11293333333333 L 108.29411764706 304.5122533333333 L 139.23529411765 302.27154666666667 L 170.17647058824 294.9322 L 201.11764705882 289.44236 L 232.05882352941 213.21051999999997 L 263 167.9552 L 293.94117647059 167.11846666666665 L 324.88235294118 151.41178666666664 L 355.82352941176 135.94634666666664 L 386.76470588235 127.43991999999997 L 417.70588235294 124.11037333333331 L 448.64705882353 107.02579999999998 L 479.58823529412 97.5739733333333 L 510.52941176471 60.631653333333304u0027 class=u0027highcharts-graphu0027 stroke=u0027%23EC473Cu0027 stroke-width=u00272u0027 stroke-linejoin=u0027roundu0027 stroke-linecap=u0027roundu0027%3E%3C/path%3E%3C/g%3E%3Cg class=u0027highcharts-markers highcharts-series-0 highcharts-line-series highcharts-color-undefined u0027 transform=u0027translate(64%2C10) scale(1 1)u0027 clip-path=u0027noneu0027%3E%3Cpath fill=u0027%23EC473Cu0027 d=u0027M 19 313 A 4 4 0 1 1 18.99999800000017 312.99600000066664 Zu0027 class=u0027highcharts-pointu0027%3E%3C/path%3E%3Cpath fill=u0027%23EC473Cu0027 d=u0027M 50 313 A 4 4 0 1 1 49.99999800000017 312.99600000066664 Zu0027 class=u0027highcharts-pointu0027%3E%3C/path%3E%3Cpath fill=u0027%23EC473Cu0027 d=u0027M 81 310 A 4 4 0 1 1 80.99999800000016 309.99600000066664 Zu0027 class=u0027highcharts-pointu0027%3E%3C/path%3E%3Cpath fill=u0027%23EC473Cu0027 d=u0027M 112 305 A 4 4 0 1 1 111.99999800000016 304.99600000066664 Zu0027 class=u0027highcharts-pointu0027%3E%3C/path%3E%3Cpath fill=u0027%23EC473Cu0027 d=u0027M 143 302 A 4 4 0 1 1 142.99999800000018 301.99600000066664 Zu0027 class=u0027highcharts-pointu0027%3E%3C/path%3E%3Cpath fill=u0027%23EC473Cu0027 d=u0027M 174 295 A 4 4 0 1 1 173.99999800000018 294.99600000066664 Zu0027 class=u0027highcharts-pointu0027%3E%3C/path%3E%3Cpath fill=u0027%23EC473Cu0027 d=u0027M 205 289 A 4 4 0 1 1 204.99999800000018 288.99600000066664 Zu0027 class=u0027highcharts-pointu0027%3E%3C/path%3E%3Cpath fill=u0027%23EC473Cu0027 d=u0027M 236 213 A 4 4 0 1 1 235.99999800000018 212.99600000066667 Zu0027 class=u0027highcharts-pointu0027%3E%3C/path%3E%3Cpath fill=u0027%23EC473Cu0027 d=u0027M 267 168 A 4 4 0 1 1 266.9999980000002 167.99600000066667 Zu0027 class=u0027highcharts-pointu0027%3E%3C/path%3E%3Cpath fill=u0027%23EC473Cu0027 d=u0027M 297 167 A 4 4 0 1 1 296.9999980000002 166.99600000066667 Zu0027 class=u0027highcharts-pointu0027%3E%3C/path%3E%3Cpath fill=u0027%23EC473Cu0027 d=u0027M 328 151 A 4 4 0 1 1 327.9999980000002 150.99600000066667 Zu0027 class=u0027highcharts-pointu0027%3E%3C/path%3E%3Cpath fill=u0027%23EC473Cu0027 d=u0027M 359 136 A 4 4 0 1 1 358.9999980000002 135.99600000066667 Zu0027 class=u0027highcharts-pointu0027%3E%3C/path%3E%3Cpath fill=u0027%23EC473Cu0027 d=u0027M 390 127 A 4 4 0 1 1 389.9999980000002 126.99600000066667 Zu0027 class=u0027highcharts-pointu0027%3E%3C/path%3E%3Cpath fill=u0027%23EC473Cu0027 d=u0027M 421 124 A 4 4 0 1 1 420.9999980000002 123.99600000066667 Zu0027 class=u0027highcharts-pointu0027%3E%3C/path%3E%3Cpath fill=u0027%23EC473Cu0027 d=u0027M 452 107 A 4 4 0 1 1 451.9999980000002 106.99600000066667 Zu0027 class=u0027highcharts-pointu0027%3E%3C/path%3E%3Cpath fill=u0027%23EC473Cu0027 d=u0027M 483 98 A 4 4 0 1 1 482.9999980000002 97.99600000066667 Zu0027 class=u0027highcharts-pointu0027%3E%3C/path%3E%3Cpath fill=u0027%23EC473Cu0027 d=u0027M 514 61 A 4 4 0 1 1 513.9999980000001 60.99600000066666 Zu0027 class=u0027highcharts-pointu0027%3E%3C/path%3E%3C/g%3E%3C/g%3E%3Cg class=u0027highcharts-axis-labels highcharts-xaxis-labels u0027%3E%3Ctext x=u002782.2990153600403u0027 style=u0027color:%23333%3Bcursor:default%3Bfont-size:12px%3Bfont-weight:bold%3Bfill:%23333%3Bu0027 text-anchor=u0027endu0027 transform=u0027translate(0%2C0) rotate(-45 82.2990153600403 352)u0027 y=u0027352u0027 opacity=u00271u0027%3E%3Ctspan%3E2%C2%B0/2016%3C/tspan%3E%3C/text%3E%3Ctext x=u0027113.24019183062853u0027 style=u0027color:%23333%3Bcursor:default%3Bfont-size:12px%3Bfont-weight:bold%3Bfill:%23333%3Bu0027 text-anchor=u0027endu0027 transform=u0027translate(0%2C0) rotate(-45 113.24019183062853 352)u0027 y=u0027352u0027 opacity=u00271u0027%3E%3Ctspan%3E1%C2%B0/2017%3C/tspan%3E%3C/text%3E%3Ctext x=u0027144.18136830121676u0027 style=u0027color:%23333%3Bcursor:default%3Bfont-size:12px%3Bfont-weight:bold%3Bfill:%23333%3Bu0027 text-anchor=u0027endu0027 transform=u0027translate(0%2C0) rotate(-45 144.18136830121676 352)u0027 y=u0027352u0027 opacity=u00271u0027%3E%3Ctspan%3E2%C2%B0/2017%3C/tspan%3E%3C/text%3E%3Ctext x=u0027175.122544771805u0027 style=u0027color:%23333%3Bcursor:default%3Bfont-size:12px%3Bfont-weight:bold%3Bfill:%23333%3Bu0027 text-anchor=u0027endu0027 transform=u0027translate(0%2C0) rotate(-45 175.122544771805 352)u0027 y=u0027352u0027 opacity=u00271u0027%3E%3Ctspan%3E1%C2%B0/2018%3C/tspan%3E%3C/text%3E%3Ctext x=u0027206.06372124239326u0027 style=u0027color:%23333%3Bcursor:default%3Bfont-size:12px%3Bfont-weight:bold%3Bfill:%23333%3Bu0027 text-anchor=u0027endu0027 transform=u0027translate(0%2C0) rotate(-45 206.06372124239326 352)u0027 y=u0027352u0027 opacity=u00271u0027%3E%3Ctspan%3E2%C2%B0/2018%3C/tspan%3E%3C/text%3E%3Ctext x=u0027237.0048977129815u0027 style=u0027color:%23333%3Bcursor:default%3Bfont-size:12px%3Bfont-weight:bold%3Bfill:%23333%3Bu0027 text-anchor=u0027endu0027 transform=u0027translate(0%2C0) rotate(-45 237.0048977129815 352)u0027 y=u0027352u0027 opacity=u00271u0027%3E%3Ctspan%3E1%C2%B0/2019%3C/tspan%3E%3C/text%3E%3Ctext x=u0027267.94607418356975u0027 style=u0027color:%23333%3Bcursor:default%3Bfont-size:12px%3Bfont-weight:bold%3Bfill:%23333%3Bu0027 text-anchor=u0027endu0027 transform=u0027translate(0%2C0) rotate(-45 267.94607418356975 352)u0027 y=u0027352u0027 opacity=u00271u0027%3E%3Ctspan%3E2%C2%B0/2019%3C/tspan%3E%3C/text%3E%3Ctext x=u0027298.8872506541579u0027 style=u0027color:%23333%3Bcursor:default%3Bfont-size:12px%3Bfont-weight:bold%3Bfill:%23333%3Bu0027 text-anchor=u0027endu0027 transform=u0027translate(0%2C0) rotate(-45 298.8872506541579 352)u0027 y=u0027352u0027 opacity=u00271u0027%3E%3Ctspan%3E1%C2%B0/2020%3C/tspan%3E%3C/text%3E%3Ctext x=u0027329.8284271247462u0027 style=u0027color:%23333%3Bcursor:default%3Bfont-size:12px%3Bfont-weight:bold%3Bfill:%23333%3Bu0027 text-anchor=u0027endu0027 transform=u0027translate(0%2C0) rotate(-45 329.8284271247462 352)u0027 y=u0027352u0027 opacity=u00271u0027%3E%3Ctspan%3E2%C2%B0/2020%3C/tspan%3E%3C/text%3E%3Ctext x=u0027360.76960359533444u0027 style=u0027color:%23333%3Bcursor:default%3Bfont-size:12px%3Bfont-weight:bold%3Bfill:%23333%3Bu0027 text-anchor=u0027endu0027 transform=u0027translate(0%2C0) rotate(-45 360.76960359533444 352)u0027 y=u0027352u0027 opacity=u00271u0027%3E%3Ctspan%3E1%C2%B0/2021%3C/tspan%3E%3C/text%3E%3Ctext x=u0027391.7107800659227u0027 style=u0027color:%23333%3Bcursor:default%3Bfont-size:12px%3Bfont-weight:bold%3Bfill:%23333%3Bu0027 text-anchor=u0027endu0027 transform=u0027translate(0%2C0) rotate(-45 391.7107800659227 352)u0027 y=u0027352u0027 opacity=u00271u0027%3E%3Ctspan%3E2%C2%B0/2021%3C/tspan%3E%3C/text%3E%3Ctext x=u0027422.6519565365109u0027 style=u0027color:%23333%3Bcursor:default%3Bfont-size:12px%3Bfont-weight:bold%3Bfill:%23333%3Bu0027 text-anchor=u0027endu0027 transform=u0027translate(0%2C0) rotate(-45 422.6519565365109 352)u0027 y=u0027352u0027 opacity=u00271u0027%3E%3Ctspan%3E1%C2%B0/2022%3C/tspan%3E%3C/text%3E%3Ctext x=u0027453.59313300709914u0027 style=u0027color:%23333%3Bcursor:default%3Bfont-size:12px%3Bfont-weight:bold%3Bfill:%23333%3Bu0027 text-anchor=u0027endu0027 transform=u0027translate(0%2C0) rotate(-45 453.59313300709914 352)u0027 y=u0027352u0027 opacity=u00271u0027%3E%3Ctspan%3E2%C2%B0/2022%3C/tspan%3E%3C/text%3E%3Ctext x=u0027484.5343094776874u0027 style=u0027color:%23333%3Bcursor:default%3Bfont-size:12px%3Bfont-weight:bold%3Bfill:%23333%3Bu0027 text-anchor=u0027endu0027 transform=u0027translate(0%2C0) rotate(-45 484.5343094776874 352)u0027 y=u0027352u0027 opacity=u00271u0027%3E%3Ctspan%3E1%C2%B0/2023%3C/tspan%3E%3C/text%3E%3Ctext x=u0027515.4754859482756u0027 style=u0027color:%23333%3Bcursor:default%3Bfont-size:12px%3Bfont-weight:bold%3Bfill:%23333%3Bu0027 text-anchor=u0027endu0027 transform=u0027translate(0%2C0) rotate(-45 515.4754859482756 352)u0027 y=u0027352u0027 opacity=u00271u0027%3E%3Ctspan%3E2%C2%B0/2023%3C/tspan%3E%3C/text%3E%3Ctext x=u0027546.4166624188638u0027 style=u0027color:%23333%3Bcursor:default%3Bfont-size:12px%3Bfont-weight:bold%3Bfill:%23333%3Bu0027 text-anchor=u0027endu0027 transform=u0027translate(0%2C0) rotate(-45 546.4166624188638 352)u0027 y=u0027352u0027 opacity=u00271u0027%3E%3Ctspan%3E1%C2%B0/2024%3C/tspan%3E%3C/text%3E%3Ctext x=u0027577.3578388894521u0027 style=u0027color:%23333%3Bcursor:default%3Bfont-size:12px%3Bfont-weight:bold%3Bfill:%23333%3Bu0027 text-anchor=u0027endu0027 transform=u0027translate(0%2C0) rotate(-45 577.3578388894521 352)u0027 y=u0027352u0027 opacity=u00271u0027%3E%3Ctspan%3E2%C2%B0/2024%3C/tspan%3E%3C/text%3E%3C/g%3E%3Cg class=u0027highcharts-axis-labels highcharts-yaxis-labels u0027%3E%3Ctext x=u002749u0027 style=u0027color:%23666666%3Bcursor:default%3Bfont-size:11px%3Bfill:%23666666%3Bu0027 text-anchor=u0027endu0027 transform=u0027translate(0%2C0)u0027 y=u0027341u0027 opacity=u00271u0027%3E%3Ctspan%3E0%3C/tspan%3E%3C/text%3E%3Ctext x=u002749u0027 style=u0027color:%23666666%3Bcursor:default%3Bfont-size:11px%3Bfill:%23666666%3Bu0027 text-anchor=u0027endu0027 transform=u0027translate(0%2C0)u0027 y=u0027286u0027 opacity=u00271u0027%3E%3Ctspan%3E25k%3C/tspan%3E%3C/text%3E%3Ctext x=u002749u0027 style=u0027color:%23666666%3Bcursor:default%3Bfont-size:11px%3Bfill:%23666666%3Bu0027 text-anchor=u0027endu0027 transform=u0027translate(0%2C0)u0027 y=u0027232u0027 opacity=u00271u0027%3E%3Ctspan%3E50k%3C/tspan%3E%3C/text%3E%3Ctext x=u002749u0027 style=u0027color:%23666666%3Bcursor:default%3Bfont-size:11px%3Bfill:%23666666%3Bu0027 text-anchor=u0027endu0027 transform=u0027translate(0%2C0)u0027 y=u0027178u0027 opacity=u00271u0027%3E%3Ctspan%3E75k%3C/tspan%3E%3C/text%3E%3Ctext x=u002749u0027 style=u0027color:%23666666%3Bcursor:default%3Bfont-size:11px%3Bfill:%23666666%3Bu0027 text-anchor=u0027endu0027 transform=u0027translate(0%2C0)u0027 y=u0027123u0027 opacity=u00271u0027%3E%3Ctspan%3E100k%3C/tspan%3E%3C/text%3E%3Ctext x=u002749u0027 style=u0027color:%23666666%3Bcursor:default%3Bfont-size:11px%3Bfill:%23666666%3Bu0027 text-anchor=u0027endu0027 transform=u0027translate(0%2C0)u0027 y=u002769u0027 opacity=u00271u0027%3E%3Ctspan%3E125k%3C/tspan%3E%3C/text%3E%3Ctext x=u002749u0027 style=u0027color:%23666666%3Bcursor:default%3Bfont-size:11px%3Bfill:%23666666%3Bu0027 text-anchor=u0027endu0027 transform=u0027translate(0%2C0)u0027 y=u002715u0027 opacity=u00271u0027%3E%3Ctspan%3E150k%3C/tspan%3E%3C/text%3E%3C/g%3E%3C/svg%3E”,”themes”:{“colors”:[“#EC473C”,”#9C3866″,”#FB7B82″,”#FEA44D”,”#B76FB5″,”#62BDE1″,”#55B46F”,”#3279BD”,”#8F91B1″,”#F7CE6A”]},”type”:”line”};
window.ShowChart = window.ShowChart || [];
window.ShowChart.push({
key: “28dt1”,
type: chartData.type,
colors: chartData.themes.colors,
options: chartData.options
});
})();
Os dados apontam que em 2020, durante o ano da pandemia de Covid-19, houve um aumento de 55.899 pessoas no regime domiciliar com monitoramento eletrônico.
Dados por estado
A pesquisa também traz os dados de monitoramento do segundo semestre de 2024 separados por estados (veja lista completa abaixo).
? Os três estados com mais pessoas com uso de tornozeleira eletrônica são Paraná, Rio Grande do Sul e Mato Grosso do Sul.
? Os estado com menor uso são: Roraima, Amapá e São Paulo.
- Acre: 2.719
- Alagoas: 1.670
- Amazonas: 1.730
- Amapá: 697
- Bahia: 2.407
- Ceará: 10.128
- Distrito Federal: 1.354
- Espírito Santo: 848
- Goiás: 10.190
- Maranhão: 1.203
- Minas Gerais: 7.895
- Mato Grosso do Sul: 10.144
- Mato Grosso: 5.813
- Pará: 5.568
- Paraíba: 3.179
- Pernambuco: 5.703
- Piauí: 1.172
- Paraná: 17.996
- Rio de Janeiro: 8.374
- Rio Grande do Norte: 2.661
- Rondônia: 3.214
- Roraima: 120
- Rio Grande do Sul: 10.582
- Santa Catarina: 3.460
- Sergipe: 1.327
- São Paulo: 731
- Tocantins: 1.217
?? Veja vídeo de como funciona a tornozeleira eletrônica:
Leia mais notícias sobre a região no g1 DF.
Fonte G1 Brasília